
Which I was pretty proud of. So proud in fact that I sat and stared at it for longer than is perhaps sane.
As you'll notice, the individual icicles are clustered into groups, with the longest of the groups in the middle and getting progressively smaller moving outwards.
Normal Distribution
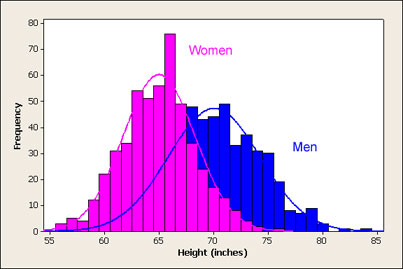
The normal distribution is one of those things that pops up everywhere. For example if you measure the heights of a significantly large group of people and plot the results you'll get a graph shaped something similar to this
Another nice example, go to Amazon and look at the customer ratings for anything. If a large enough number of people have rated it, you'll probably notice this same sort of shape; usually with the one star rating spiking to not fit the pattern (damn hipsters). Some are more pronounced fits than others.
And as I say, this sort of thing shows up all over the place. This is partly due to the central limit theorem, but that's a whole other kettle of fish.
Equations Everywhere
I was partly inspired by a program I recently watched - The Joy of Stats - and partly by the website "Found Functions", whose creator finds graphs (and their accompanying formulas) in photos of everyday scenes.
I flipped the photo vertically (for clarity) and skewed it slightly to try to account for the fact that it was taken side-on, then put some normal curves on it to hopefully prove I'm not just crazy and imagining it


They're not perfect fits, partly due to perspective. But you hopefully get the idea. Why do the icicles form like that? Because nature's just fantastic in that way.
Oatzy.
2 comments:
Love the icicles!
Why thank you :)
Post a Comment