The X-Factor Volcano
Using TwitScoop I got this graph of tweet volume for last Saturday (times are approximate)
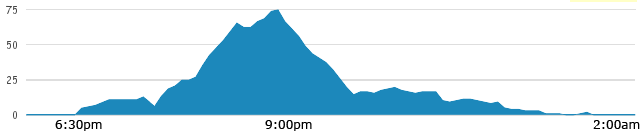
Would you..?
This was mostly just playing with a type of graph on ManyEyes - graphing (some of) the lyrics of Hero by Enrique Igelsias

Student Loans (So Far)
This basically graphs what I owe already, from two years of university study

Total? Nearly £15,000! Joy.
Write Her a Song
I got a list from some website, of songs about girls (where a first name is explicitly given). I counted occurrences of names and made this word cloud of popular names

Obviously, this isn't comprehensive, since I only used a relatively small sample of songs. But you get the idea.
The Big Bang
My favourite. And this is the Doctor Who episode we're talking about (season 5 finale).
Basically, I plotted out the character's timelines (a la XKCD), using a website I can't seem to find, in an attempt to make the plot clearer. It didn't turn out exactly as I wanted because the web-app had a mind of it's own. But I'm still happy with it.

And that's you lot. Til next time,
Oatzy.
No comments:
Post a Comment